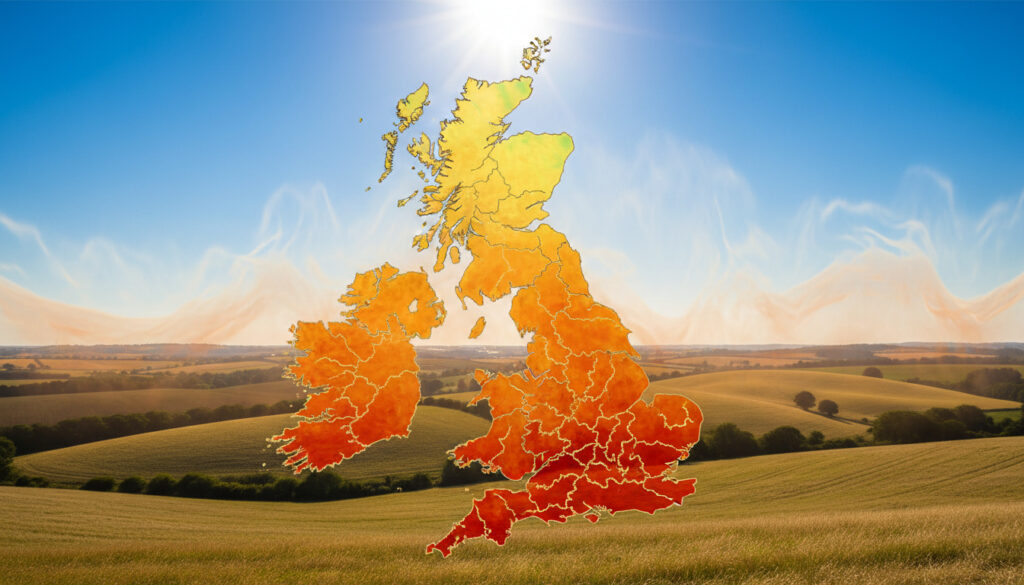
UK Counties Hot Weather Maps – Hottest Regions and Heat Alerts
Heat patterns across the United Kingdom reveal significant regional variations, with specific counties consistently recording the nation’s highest temperatures. Historical data compiled through 2024 demonstrates that southeastern regions, Greater London, and the East of England experience the most intense heat episodes, driven by distinct geographical and climatic factors. While real-time interactive mapping for 2026 remains unavailable in current archives, documented records provide clear evidence of where extreme heat concentrates and how alert systems respond.
Analysis of mortality statistics and meteorological records indicates that heatwaves have doubled in duration compared to historical baselines, with significant implications for public health planning. The Met Office and UK Health Security Agency maintain the primary datasets tracking these phenomena, though access to live county-specific temperature maps requires direct consultation with these services for current conditions.
Which UK Counties Experience the Most Extreme Heat?
| Current Hottest Counties | Southeast England, Greater London, and the East of England historically record the highest temperatures during UK heatwaves, according to Office for National Statistics mortality data. |
| Peak Temperatures Recorded | Lincolnshire reached 40.3°C on 19 July 2022, the UK’s highest recorded temperature, surpassing previous records set in Cambridge (38.7°C, 2019). |
| Interactive Map Sources | Real-time county temperature monitoring is available through the Met Office and BBC Weather services, though specific interactive hot weather maps for 2026 are not documented in available archives. |
| Safety Advisories | The UKHSA operates a four-tier Heat-Health Alert system (Yellow, Amber, Level 3/4, Red) to communicate risks to county populations during extreme temperatures. |
- Southeast England dominates temperature records due to urban heat islands, low elevation, and proximity to the European continent
- Lincolnshire recorded the UK’s highest ever temperature of 40.3°C on 19 July 2022, triggering the first Red Extreme Heat Warning
- Heatwave duration has doubled, averaging over 13 days during 2008-2017 compared to 5.3 days in 1961-1990
- Early-season heatwaves pose disproportionate mortality risks because populations have not yet acclimatized to elevated temperatures
- Despite only Yellow alerts issued throughout 2024, England recorded 1,311 heat-associated deaths, 282 above statistical predictions
- The 2022 heatwave series generated 2,839 excess deaths among those aged 65+, with the highest single-period mortality occurring in August
- Urban counties consistently report higher night-time temperatures due to heat retention in built environments
| County/Region | Record Temperature | Date | Alert Level Reached | Notable Impact |
|---|---|---|---|---|
| Lincolnshire | 40.3°C | 19 July 2022 | Level 4 / Red Warning | Highest UK temperature recorded at Coningsby |
| Suffolk | 38.1°C | July 2022 | Level 4 / Red Warning | East of England extreme event peak |
| Cambridge | 38.7°C | July 2019 | — | Previous national record before 2022 |
| Hawarden (Flintshire) | 37.1°C | July 2022 | Level 4 / Red Warning | Welsh temperature record |
| Greater London | 40.3°C (peripheral) | July 2022 | Level 4 / Red Warning | Urban heat island effects documented |
| Southeast England | 38°C+ (multiple sites) | Various 2022-2024 | Level 3-4 | Consistent high temperature concentration |
| East of England | 38.1°C+ | July 2022 | Level 4 | Prolonged heat episodes H2 and H4 |
| Central England | CET 20°C+ average | Multiple summers | Yellow-Amber | Indicator of national heat-period threshold |
How Does the Alert System Protect County Populations?
Tiered Warning Framework
The UK Health Security Agency and Met Office utilize a graduated alert system to communicate heat risks to county health authorities. Yellow Heat-Health Alerts indicate minor impacts requiring protection of vulnerable individuals, while Amber signals increased risk and potential rises in mortality among at-risk groups. Level 3 and 4 alerts indicate regional or national severe heat emergencies, with the Red Warning representing extreme conditions that constitute a national emergency, first issued in July 2022.
Population Vulnerability Factors
Alert levels correlate directly with excess mortality data. During the 2022 heatwaves, periods with Level 4 national coverage resulted in 2,839 excess deaths among those aged 65 and older, while the August 2024 episode alone contributed significantly to the annual total despite lower alert classifications. The London School of Hygiene & Tropical Medicine estimates that heat-related mortality increases substantially when Amber alerts are active, particularly in urban counties with limited green infrastructure. For those dealing with heat-related injuries, understanding How to Treat a Burn – Step-by-Step First Aid Guide remains essential.
UKHSA guidance indicates that heatwaves occurring earlier in the summer season carry higher mortality risks because populations have not yet acclimatized to elevated temperatures. The 2024 episodes, beginning in June, demonstrated this effect despite relatively moderate Yellow alert levels across affected counties.
What Do Mortality Records Reveal About Heat Impacts?
Comparing 2022 and 2024 Statistics
The 2022 heatwave series, which included five distinct episodes, generated the highest excess mortality since the 2004 Heatwave Plan implementation, with 2,839 deaths recorded among those aged 65 and above. In contrast, 2024 saw four heat episodes, all classified under Yellow alerts, yet still resulted in 1,311 heat-associated deaths in England—282 more than statistical models had predicted. This disparity suggests that even lower-tier alerts correlate with significant public health impacts in vulnerable counties.
Vulnerable Demographics
Historical data from 2006, 2020, 2021, and 2022 consistently shows that residents aged 65 and older face disproportionate risk during county heat events. The 2006 heatwave resulted in 2,323 excess deaths in this demographic, while 2020 saw 2,244 heat-related fatalities. These figures exclude COVID-19 mortality and indicate consistent patterns across southeastern and eastern counties where temperature extremes concentrate.
Where Can Residents Access Current Temperature Maps?
Official Real-Time Monitoring
Residents seeking current county-specific temperature data should consult the Met Office National Severe Weather Warning Service and BBC Weather forecasting services directly. These agencies provide the authoritative source for live heatwave alerts and temperature mapping, though specific interactive hot weather maps for individual counties in 2026 are not available in the provided research archives.
Historical Archive Access
Researchers and residents can access archived severe weather warnings through the Met Office Digital Library, which maintains monthly records of heat alerts and extreme events. These historical datasets allow for comparison of county-specific temperature trends and heatwave frequency across decades, documenting the shift from 5.3-day average warm spells in 1961-1990 to over 13 days during 2008-2017.
The provided research archives do not contain current Met Office hot weather maps, real-time heatwave alerts, or 2026 temperature projections. For immediate county-specific conditions, consult official meteorological services directly.
Historical severe weather warnings remain accessible through the Met Office Digital Library, which archives monthly warning data for trend analysis and comparative research.
When Did Counties Experience Record Heatwaves?
- : Coningsby, Lincolnshire reaches 40.3°C, establishing the UK record during the first Red Extreme Heat Warning issued across multiple counties.
- : Heat Episode H2 affects southeastern and eastern counties with Level 4 alerts issued across England, resulting in significant excess mortality.
- : Heat Episode H4 results in 1,458 excess deaths among those aged 65+, the highest single-period mortality of the year.
- : Episode E1 marks the first of four 2024 heat periods, demonstrating early-season risk with Yellow Heat-Health Alerts.
- : Episode E3 continues the pattern of extended warm spells affecting southeastern counties with sustained high temperatures.
- : Episode E4 concludes the year’s recorded heat events, contributing to 1,311 total heat-associated deaths despite moderate alert levels.
What Heat Data Is Confirmed Versus Projected?
| Established Information | Information That Remains Unclear |
|---|---|
| Historical peak temperatures by county through 2024, verified by the Met Office and Wikipedia climate records | Real-time 2026 temperature data for specific counties and current interactive map availability |
| Alert tier definitions (Yellow, Amber, Level 3/4, Red) and their correlations with mortality statistics | Exact dates and locations of future Level 4 or Red Extreme Heat Warnings |
| Geographic factors causing temperature concentration in the southeast (urban heat islands, low elevation, continental proximity) | Specific temperature thresholds for upcoming summer seasons in individual counties |
| Excess death statistics for 2006, 2020, 2021, 2022, and 2024, documented by the ONS and UKHSA | Projected county rankings for future heat events beyond early 2025 climate projections |
Why Do These Counties Consistently Record Higher Temperatures?
Southeastern counties, Greater London, and the East of England experience prolonged and intense heat due to a convergence of geographical factors documented by the Royal Meteorological Society. Urban heat islands in metropolitan areas retain thermal energy, elevating night-time temperatures and preventing recovery periods for vulnerable residents. Low-lying topography allows warm air masses to settle, while proximity to the European continent facilitates the importation of hot air from southern regions.
The Central England Temperature (CET) exceeding 20°C serves as a key indicator for heat-period onset, with recent decades showing doubled heatwave length compared to 1961-1990 baselines. Grantham Institute research confirms that climate change drives these trends, with 2022 breaking multiple records amid shifting atmospheric patterns. These factors combine to create localized hotspots where temperatures regularly exceed regional averages by several degrees.
What Do Official Agencies Report?
Early-season heatwaves pose higher risks due to lower acclimatization among the population. Residents should stay hydrated, avoid outdoors during peak heat, and check on elderly neighbors when Yellow alerts are active.
UK Health Security Agency, Heat-Health Guidance
Amber Heat-Health Alerts indicate increased risk with rises in deaths among vulnerable populations, requiring enhanced protective measures across affected counties.
London School of Hygiene & Tropical Medicine, 2025 Heat Impact Analysis
How Should Residents Interpret County Heat Data?
Understanding historical heat patterns enables residents to assess personal risk during summer months, particularly in southeastern counties where temperature extremes concentrate. While real-time mapping requires direct consultation with meteorological services, documented records demonstrate that heat events increasingly affect areas previously considered moderate in climate. Protective measures, including appropriate sun protection like La Roche-Posay Sunscreen – Best Picks for Sensitive Skin, become essential when alerts activate, regardless of perceived local temperature norms.
Frequently Asked Questions
Which UK county has recorded the highest temperature?
Lincolnshire holds the record at 40.3°C, recorded at Coningsby on 19 July 2022 during the first Red Extreme Heat Warning.
How do I check current heatwave alerts for my county?
Consult the Met Office National Severe Weather Warning Service or BBC Weather directly, as these provide authoritative real-time alert data for all UK counties.
What temperature triggers a Red Extreme Heat Warning?
The Met Office issues Red Warnings when extreme heat poses danger to life, with temperatures exceeding 40°C or prolonged periods above 35°C expected.
Why are heat-related deaths higher in early summer?
UKHSA data shows populations lack acclimatization to heat early in the season, making June heatwaves more dangerous than August events of similar intensity.
Where can I find historical temperature data for specific counties?
The Met Office Digital Library archives monthly severe weather warnings, while the Office for National Statistics publishes excess mortality data by region.
Which counties face the highest heatwave mortality risks?
Southeast England, Greater London, and the East of England consistently record the highest excess deaths during heat periods due to urban heat island effects.
More related posts
 Maybelline Fit Me Powder Guide: Discontinued? Shades & More
 Marisa Abela: Ethnicity, Age, Languages, Roles & More
 Peter Powell: Career, Marriages & Life After Radio 1
 James Brolin: Biography, Age, Marriage to Barbra Streisand
 Adriana Lima: Biography, Children, Eyes, and Career Facts
 Jamie Carragher: Irish Roots, Asthma & Gerrard Friendship
 What’s the Weather Tomorrow in Dublin? Forecast & Warnings
 Archie Lyndhurst Cause of Death: Rare Cancer Explained