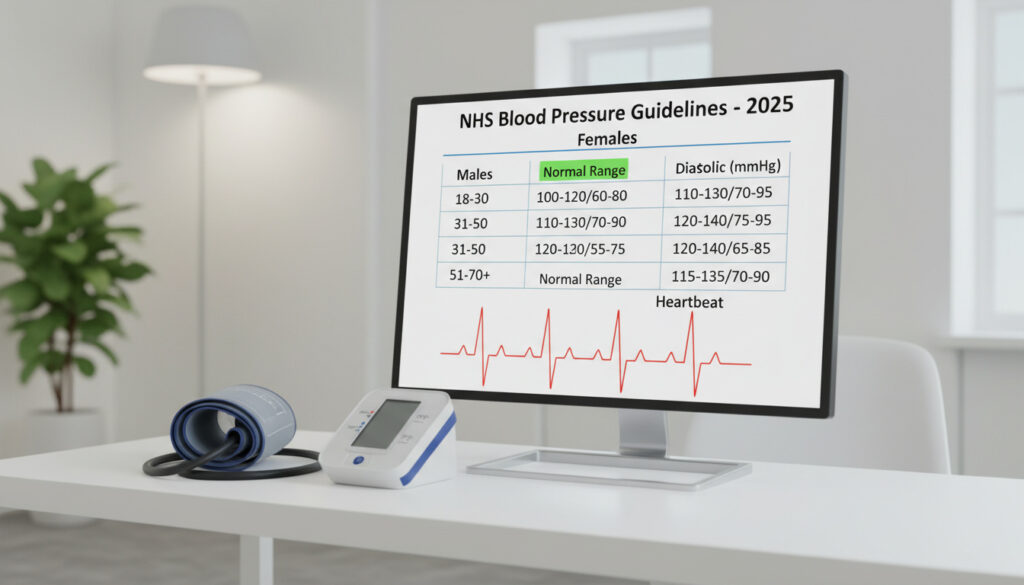
NHS Blood Pressure Chart by Age and Gender – Normal Ranges 2025
Blood pressure readings serve as vital indicators of cardiovascular health, yet healthy values shift significantly across life stages and between sexes. While adults often target readings around 120/80 mmHg, the National Health Service recognises that normal ranges vary considerably depending on whether you are 25 or 85, male or female.
Standard measurements use millimetres of mercury (mmHg), expressing systolic pressure (when the heart beats) over diastolic pressure (when it rests). The British Heart Foundation establishes that normal adult blood pressure generally falls between 90/60 mmHg and 120/80 mmHg, though individual circumstances and medical history require personalised assessment.
NHS trusts across the UK provide age-specific and gender-specific benchmarks to help patients interpret their results accurately. These references account for physiological changes including arterial stiffening with age and hormonal variations between men and women.
What is normal blood pressure by age?
Newborns to School Age
60–90/20–60 mmHg rising to 97–112/57–71 mmHg
Adults 18–39
Women: 110/68 mmHg
Men: 119/70 mmHg
Adults 40–59
Women: 122/74 mmHg
Men: 124/77 mmHg
Adults 60+
Women: 139/68 mmHg
Men: 133/69 mmHg
Over 80: <150/90 mmHg
Key insights from NHS data
- Women aged 18–39 typically demonstrate lower systolic pressure than men of the same age (110/68 versus 119/70 mmHg)
- Gender patterns reverse after age 60, with women showing higher average systolic readings than men (139/68 versus 133/69 mmHg)
- Adults over 80 should maintain readings below 150/90 mmHg in clinical settings, or below 145/85 mmHg when measured at home
- Readings consistently between 120/80 and 140/90 mmHg indicate elevated risk for developing hypertension
- Children require distinct assessment charts, with newborns showing significantly lower pressures (60–90 mmHg systolic) than adolescents (112–128 mmHg)
- Blood pressure naturally tends to increase with age due to reduced arterial elasticity
Reference values by age group
| Age Group | Systolic (mm Hg) | Diastolic (mm Hg) |
|---|---|---|
| Newborns (up to 1 month) | 60–90 | 20–60 |
| Infants | 87–105 | 53–66 |
| Toddlers | 95–105 | 53–66 |
| Preschoolers | 95–110 | 56–70 |
| School-aged children | 97–112 | 57–71 |
| Adolescents | 112–128 | 66–80 |
| Adults 18–39 (Women) | 110 | 68 |
| Adults 18–39 (Men) | 119 | 70 |
| Adults 40–59 (Women) | 122 | 74 |
| Adults 40–59 (Men) | 124 | 77 |
| Adults 60+ (Women) | 139 | 68 |
| Adults 60+ (Men) | 133 | 69 |
NHS blood pressure checker and calculator by age
Digital tools provided by NHS organisations allow patients to assess their readings against age-appropriate benchmarks. The King Edward VII Hospital NHS Trust offers a calculator that evaluates measurements against standard ranges, while NHS England provides an interactive online checker with immediate guidance.
Clinical versus home monitoring
Measurements taken in GP surgeries may differ from those recorded at home. The phenomenon known as “white coat hypertension” can cause elevated readings in clinical settings due to anxiety. Home monitoring proves particularly valuable for patients experiencing this effect, offering a clearer picture of typical cardiovascular load.
Taking measurements at home periodically helps determine if readings consistently fall within acceptable ranges for your specific age and gender. Home thresholds differ slightly from clinical targets, with readings below 135/85 mmHg generally considered controlled for adults under 80.
Recommended screening intervals
NHS guidelines recommend that all adults over 40 years undergo blood pressure testing at least every five years to detect potential problems early. Those diagnosed with hypertension or at elevated risk require more frequent monitoring. Testing remains available at GP surgeries, participating pharmacies, workplaces, and through NHS Health Check appointments for adults aged 40–74 in England.
Blood pressure chart UK: NHS guidelines
The National Health Service categorises adult blood pressure into distinct clinical thresholds. These classifications apply uniformly across adult age groups, though treatment targets may vary for older patients.
Adult classification categories
| Category | Reading (mm Hg) |
|---|---|
| Normal | <120/<80 |
| Elevated | 120–129/<80 |
| Hypertension Stage 1 | 130–139 or 80–89 |
| Hypertension Stage 2 | ≥140 or ≥90 |
| Hypertensive Crisis | >180/>120 (seek immediate medical help) |
Mid and South Essex NHS Integrated Care System advises that patients with readings between 120/80 and 140/90 should consider lifestyle modifications to prevent progression to hypertension.
Printable tracking resources
For patients managing chronic conditions or tracking white coat hypertension, the British Heart Foundation provides downloadable blood pressure diaries. These charts allow systematic recording of twice-daily readings to establish patterns for medical review.
For adults over age 80, the ideal blood pressure target is under 150/90 mmHg when measured clinically, or under 145/85 mmHg when taken at home. These slightly higher thresholds reflect the need to maintain adequate blood flow while reducing cardiovascular risk.
Blood pressure chart by age, gender and height
While age and gender significantly influence blood pressure norms, the integration of height and body composition into standard NHS charts remains limited. Current NHS guidelines focus primarily on age-stratified and gender-specific thresholds rather than height-adjusted calculations.
Gender-specific patterns across lifespan
Data indicates distinct trajectories for men and women. Premenopausal women typically maintain lower systolic pressure than men of equivalent age. However, after age 65, women frequently exhibit higher systolic readings than their male counterparts. By age 60 and above, women average 139/68 mmHg compared to men’s 133/69 mmHg, representing a reversal of the young adult pattern.
Height and physiological build
The available NHS documentation does not specify height-based adjustments for adult blood pressure assessment. While body mass and cardiovascular workload relate to stature, standard UK clinical practice relies on the age and gender categories rather than height-specific charts.
Current NHS search results do not contain specific blood pressure calculations related to pregnancy, height, or heart rate correlations. Patients seeking guidance on these specific factors should consult their GP surgery or maternity services for individualised assessment.
How blood pressure changes through life stages
- Newborn period (up to 1 month): Systolic 60–90 mmHg, Diastolic 20–60 mmHg
- Infancy: Systolic rises to 87–105 mmHg, Diastolic 53–66 mmHg
- Toddler years: Stabilises around 95–105/53–66 mmHg
- Preschool age: Increases to 95–110/56–70 mmHg
- School age: Reaches 97–112/57–71 mmHg
- Adolescence: Approaches adult ranges at 112–128/66–80 mmHg
- Early adulthood (18–39): Women 110/68 mmHg, Men 119/70 mmHg
- Middle age (40–59): Women 122/74 mmHg, Men 124/77 mmHg
- Senior years (60+): Women 139/68 mmHg, Men 133/69 mmHg
- Advanced age (80+): Target below 150/90 mmHg (or 145/85 mmHg at home)
What is certain versus unclear about blood pressure targets
| Established Information | Information Remaining Unclear |
|---|---|
| Normal adult range: 90/60–120/80 mmHg | Precise height-based adjustments for adults |
| Clinical hypertension threshold: ≥140/90 mmHg | Specific pregnancy blood pressure norms |
| Home monitoring target: <135/85 mmHg (<145/85 for over 80s) | Exact heart rate correlations by age and gender |
| Women show lower BP than men until age 60–65, then higher systolic | Individual targets for patients with complex comorbidities |
| Screening every 5 years for adults over 40 | Optimal thresholds for adolescents transitioning to adult categories |
Why age and gender affect cardiovascular markers
Arterial walls naturally lose elasticity with advancing age, requiring greater systolic pressure to circulate blood effectively. This physiological stiffening explains the gradual upward trend in acceptable ranges from adolescence through late adulthood.
Hormonal profiles create the gender divergence observed in clinical data. Premenopausal women often benefit from oestrogen-mediated vascular protection, maintaining lower pressures than men. Following menopause, the reduction in these protective effects contributes to the reversal where older women frequently exceed male readings. Understanding these patterns helps contextualise individual results when reviewing What Is Heart Disease – Symptoms, Causes, Prevention. Дізнайтеся більше про нормальний артеріальний тиск за віком та статтю за цим посиланням: Чи можна померти від печії уві сні.
NHS clinical guidance and source authority
Normal blood pressure for adults is generally considered to be between 90/60 mmHg and 120/80 mmHg.
— British Heart Foundation and NHS Trusts
It’s recommended that all adults over 40 years of age have their blood pressure tested at least every five years to detect potential problems early.
— King Edward VII Hospital NHS Trust
These recommendations align with guidelines from NHS England, NHS Scotland (available through the Right Decisions clinical knowledge platform), and the British Heart Foundation. When to Worry About Creatinine Levels – Normal Ranges by Age provides additional context on related kidney function markers that often correlate with cardiovascular health.
Key takeaways for monitoring your blood pressure
Healthy blood pressure varies significantly by demographic profile, with distinct thresholds for children, younger adults, seniors, and the over-80s. Women and men follow different patterns across the lifespan, typically crossing over around age 60–65. Regular monitoring using NHS-validated tools, whether through GP surgeries, home devices, or online checkers, enables early detection of hypertension. Patients should aim for clinical readings below 140/90 mmHg (or 135/85 mmHg at home), with specific adjustments for those over 80, while understanding that pregnancy, height, and heart rate require individualised medical consultation.
Frequently asked questions
What do the two numbers in a blood pressure reading mean?
The first number (systolic) measures pressure when the heart beats. The second (diastolic) measures pressure when the heart rests between beats. Both use millimetres of mercury (mmHg).
How often should adults over 40 check their blood pressure?
NHS guidelines recommend testing at least every five years for adults over 40 without existing hypertension. Those diagnosed with high blood pressure or at high risk require more frequent monitoring.
Where can I find a printable chart to record my readings?
The British Heart Foundation offers downloadable blood pressure diaries through their Heart Matters magazine resources. The NHS also provides online tracking tools.
What is considered low blood pressure?
Readings below 90/60 mmHg generally indicate low blood pressure (hypotension). Consult a doctor if you experience dizziness, fainting, or blurred vision alongside low readings.
What is white coat hypertension?
This phenomenon causes elevated blood pressure readings in clinical settings due to anxiety, while home measurements remain normal. Home monitoring helps identify this condition.
Are home readings different from clinic readings?
Yes. Home targets are typically lower than clinical thresholds. For adults under 80, home readings should remain below 135/85 mmHg, while clinic readings aim below 140/90 mmHg.
What is the normal heart rate for women by age?
Current NHS sources do not provide specific age-related heart rate charts for women. Consult your GP for guidance on resting heart rate norms appropriate to your age and fitness level.
What blood pressure is normal during pregnancy?
Available NHS documentation does not specify pregnancy-specific blood pressure ranges. Pregnant women should seek immediate guidance from their midwife or GP regarding individual targets.
More related posts
 Mens Medium Length Hairstyles – Top 2025 Styles and Tips
 Archie Lyndhurst Cause of Death: Rare Cancer Explained
 Malachi Barton: Age, Dating, Parents & Social Media Facts
 Reacher Season 3 Cast – Full List of Actors and Roles
 Neil Sedaka Dies at 86: Cause of Death, Career and Feuds
 Fara Williams: Biography, Stats, Retirement & Current Work
 How to Lower Cholesterol: Fastest Ways, Worst Foods
 Mr Bigstuff Season 2: Release Date, Cast, Episodes and Renewal